
Insights Three Ways: Express Mission Designs For A Range of Outputs
We wanted to know about young adults' pandemic experience. We designed three, quick-turn Express missions—each of which produced vastly different (but widely valuable) types data.
Express missions are flexible. You have a broad array of question types, a large pool of potential participants, and the opportunity to generate a wide-range of insights.
So...is an Express mission right for your research question? If it is...which of the countless possible approaches should you take to designing your study?
We’ll walk you through three of our favorite ways to leverage the quick, media-rich, capabilities of Express—demonstrating what an ideal design might be for your next mission.
For this example: We wanted to understand how young adults in particular experienced the pandemic, and what they’re thinking about now that they’re restrictions are lifting. Here are three different studies—covering different methodologies and topics—that gave us insight into this broad and important space.
First: Why run an Express mission?
It’s fast and feels “low-stakes.” Sometimes, you’re not looking for the next benchmark study for your company—you just have a little curiosity about something, or want to quickly gut-check an intuition. With Express, you can get answers back from participants in 1-2 days, without a lot of overhead. This opens up a whole new way of interacting with participants in a low-stakes, casual way, and gets you quick answers for the questions that don’t quite merit the rigamarole of a full research project.
Lower barriers to entry can mean higher engagement. If you’re looking for a larger scale, quantitative approach to research, launching an Express mission can boost engagement with minimal effort on your part. The turnaround is also whip-fast—even for relatively big sample sizes. We just launched a 500 person study with a narrow age range (13-22) and had a full, automatically recruited, sample within about 4 days of launch. Express is also a great way to quantitatively check your qualitative insights run in Diary, Live, or another Express mission.
You can iterate. Running Express can let you get the lay of the land before writing a more in-depth survey or IDI guide. You can even pressure test phrasing for questions and find the right vocabulary to resonate with your audience. These kinds of missions are versatile and no question is too small to float here.
You get small chunks of qualitative data quickly. Capturing a small part of scouts’ lives in-context, whether it’s something in their homes, an app they're using, or a quick opinion or insight—is really easy to gather one at a time with Express. You can collect pictures and videos to create an impactful set of artifacts to socialize, either as a stand-alone or as an extra element to a study run in Diary or Live.
You can approach a problem from multiple perspectives at once, painting a 360 picture of your problems space in a fast turnaround.
Approach 1: Quantitative, n=500
We wanted to learn about how teenage scouts experienced learning this year. Everyone hears a lot from adults about remote working, but we wanted to know how school has been straight from those who were experiencing it.
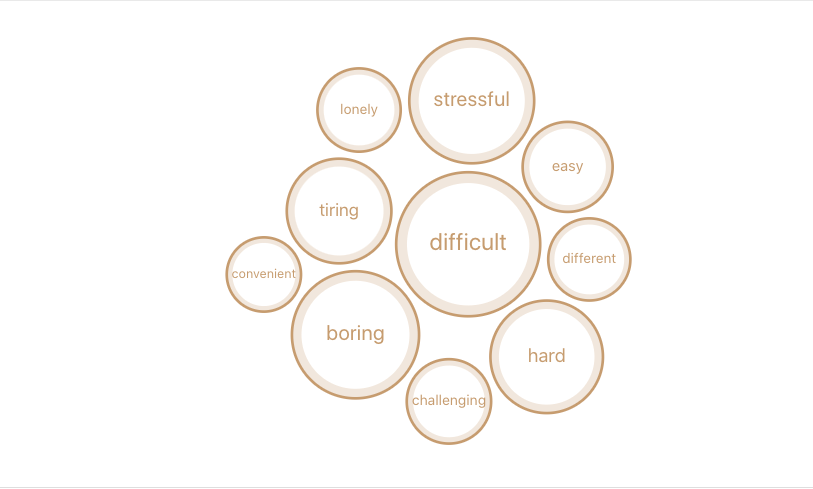
We designed a large-scale study to get a sense of the sentiments around remote learning and how it compares to in-person learning for the average teenager. This study was only close-ended questions, with one open-ended, word-cloud generating question.
When to chose this approach:
- You want to gather background information from a large number or people.
- You want to run recurring benchmark questions or studies.
- You have specific, crystallized answers that you need.
- You understand a question well enough to not only provide a prompt, but also the likely answers from users, and you just want to get a sense of relative frequency.
- You want to validate qualitative insights you’ve already produced elsewhere.
- You want eye-catching numbers for deliverables. Especially for audiences that are unused to qualitative insights, numbers carry “weight” and are good to have in your corner!
Example questions:
- How would you compare your *productivity* in remote learning compared to in-person learning?
- List three words that you think best describe the experience of remote learning.
- How would you compare your *motivation* in remote learning compared to in-person learning?
- How would you compare your *happiness* in remote learning compared to in-person learning?
- Out of the following list, which do you think is the *biggest benefit* to remote learning?
- Out of the following list, which do you think is the *biggest drawback* to remote learning?
- Please choose three emotions that you most associate with remote learning from the following list.
- Overall, how would you describe your experience of remote learning?


Tips for analyzing a quant study on Express:
Here, the analysis tab on dscout really shines. Responses to ranking questions, scale questions, and multiple choice questions, all populate to charts for “at-a-glance” insights.
Beyond that, if you do ask any brief open-ends, the word cloud generator on the open-end response analysis page is a quick way to get a sense of your data without combing through your entire sample.
Rely on this for broad insights and easily quantifiable & digestible findings. For more nuanced findings, try pairing it with a qualitative follow-up mission at a smaller scale.
Approach 2: Artifact mission, n=100
We wanted to hear more human stories of the youth pandemic experience. To do this we decided to launch a mission that explored the ways people have been coping with the stress and isolation, and how they’ve even found some joy this year.
We took a concrete artifact approach to this question: we asked people to show us one thing that has brought them comfort or joy in the pandemic and tell us about it.
We ended up with 100 pictures of comforting objects, hobbies, and people—as well as the stories and sentiments of how those objects have been important in young peoples’ lives.
When to choose this approach:
- You want to produce sharp vignettes of user experience to bring a theme or issue to life.
- You want a concrete way to get at more abstract emotions. It’s easier for people to talk about one thing that’s comforting than the idea of comfort, producing better and more detailed verbatims for you to work with.
- You’re looking for a final deliverable that’s crisp, visually engaging, and emotionally sticky. The “end-content” here is great for socializing to large audiences!
- You want to supplement to bring narrow elements of a larger context into sharp relief.
- Your quantitative data is feeling a bit sterile. This approach is deeply human and puts user stories at the forefront.
Example questions:
- Please take a picture of the comforting thing you listed. If the thing is more abstract (like a hobby), take a picture of an object that you think best represents it.
- Tell us about the role this comforting thing plays in your day-to-day life. How do you engage with it, and how often?
- Complete this sentence: this thing has brought me comfort during the pandemic by….
- Complete this sentence: without this thing in my life, I would feel...
Tips for analyzing an artifact mission on Express:
Analysis here is about storytelling more than anything else. Find the most compelling stories and the most visually engaging data, and highlight it to supplement insights that have been established elsewhere.
The pictures or media generated from this type of mission really is what makes deliverables shine. Make sure those “user vignettes” make it into any final presentation to help generate emotional buy-in.
To get at some of those “most compelling stories” along a given theme, tag your data, or use easy close-ended questions to the front of your study. That way you can quickly filter to the content that you need. The dscout “expressiveness” feature should also help you pull out data from more engaged or thorough scouts.
A note here that this sort of data might not be best on its own, for establishing concrete, actionable, insights. Use it to color data from elsewhere, or to glean a “softer” understanding of participant experiences.


Approach 3: Qualitative, n=30
Our final question was about re-emergence into the world as the pandemic restrictions begin to lift. As this is yet to happen, we treated this study as an opportunity to explore possible themes and findings by asking thought-provoking open-ended questions and asking scouts to expound on their deeper beliefs.
This study was smaller and we paid scouts more. We also spent more time on the analysis—we wanted to really get to know these users’ hopes and dreams.
When to chose this approach:
- You want to provide nuance, or get at the emotion behind a user problem.
- You want to explore and understand a new problem space—and you’re not quite sure what you’re looking for yet. This is a great way to explore a space before committing to any one method or line of questioning for a larger-scale research project.
- You’re looking to generate “bottom-up insights.” Since you’re not providing close-ended options, participant answers are less likely to be affected by bias you might have.
- You want to follow-up to surprising insights you’ve found in other research. Weren’t expecting participants to dislike a new feature? Quick-hit qual research can be a great way to find out why!
- You’re invested in developing resonant deliverables from the get-go. Videos are not only a great source of data, but can also be artifacts in their own way. Socializing media reels can be a good way to make an otherwise dry insight feel more memorable and human.
Example questions:
- What’s an activity, habit, or way of thinking that you want to *double down on* post-pandemic? That is, what’s something you started during the pandemic that you want to continue dedicating time or energy to? Why?
- What’s an activity, habit, or way of thinking that you want to *shut down* post-pandemic? That is, what’s something from before or during the pandemic that you want to stop doing? Why?
- Is there any activity, habit, or way of thinking that you want to *finally resume* post-pandemic? That is, is there something from before the pandemic that you miss and are excited to start again?
Tips for analyzing an deeper qualitative study on Express
Qualitative analysis can take the longest amount of time to analyze, but the insights are worth the while. Using Express can actually break up otherwise overwhelming amounts of qual data into manageable, sequential chunks.
Using close-ended questions can help “break things up” strategically so “future you” can filter the data easily, without having to tag. Instead of asking “how do you feel about our product, and why?”—make the first half of the question into a close-ended question.
We also recommend keeping your qualitative studies small (n=40 or less); after that, they will likely have diminishing returns. If you need a larger sample for quant, just run a separate Express mission.
Once you have your data, and have set yourself up to sift through it strategically, you have a lot of tools for storytelling at your disposal. Use the “highlight feature” to pick out the juiciest quotes and export them all at once. Then, pair those quotes with quant findings for nuance and impact.
Plus, take advantage of the in-platform playlist builder to cut together scout videos for a highly impactful (and easily shareable) reel of participant opinions.
Karen is a researcher at dscout. She has a master’s degree in linguistics and loves learning about how people communicate with each other. Her specialty is in gender representation in children’s media, and she’ll talk your ear off about Disney Princesses if given half the chance.


Subscribe To People Nerds
A weekly roundup of interviews, pro tips and original research designed for people who are interested in people


