Putting a Finger on Our Phone Obsession
Mobile touches: a study on how humans use technology
Q. How often do we touch our phones?
A. Oh, only about 2,617 times a day.
We all know life hasn’t been the same since Apple launched the iPhone nearly ten years ago. That little screen is always nearby—in our pocket or backpack, on the nightstand or under the pillow—beckoning us.
Each of us feels the pull, and it’s hard to dimensionalize. How much are we really attached to our phones physically, cognitively…emotionally? As People Nerds, the dscout research team exists to understand that pull.
When we first dug in, what we discovered was a dearth of good data. Pundits have long tossed about statistics for how often we use our phones, but pretty much everyone references the same 2013 Kleiner Perkins report citing 150 mobile sessions a day—and often that number is taken out of context.
We decided to dig for some data of our own.
dscout’s web-based research platform pairs with a smartphone app to capture in-the-moment behaviors. For this study, we recruited a demographically diverse sample of 94 Android users from our pool of more than 100,000 participants. Then we built a supplementary smartphone tool to track every user’s interaction across 5 days, 24 hours a day.
And by every interaction, we mean every tap, type, swipe and click. We’re calling them touches.
Like a Greek tragedy, what we learned was simultaneously expected and astonishing—and a little bit sad. What follows are insights to help you better understand the intensity of the mobile life your users live, so your brand, products and strategies can become part of it.
For more on how this study was conducted and additional takeaways, download a free copy of the report.
What's covered:
Click to jump to that question and answer, or scroll to read them all top to bottom.
1. How many times a day do users interact with their phone?
2. How many sessions a day do people use their phones?
3. What times of day do people touch their phones most?
4. What about when your phone is locked?
5. How many apps are people actually using?
6. What apps are touched the most?
7. Do some app types generate more touches than others?
8. How often do we touch anything that’s *not* made by Google or Facebook?
9. What apps do we use together in a session?
10. Do people care how much they use their phones?
11. Is this a good use of people's time?
What we measured:

We designed the study for 100 scouts for 5 days. By the end, we had 94 scouts.
About 2/3 of them participated 5 days; the remainder participated 2 to 4 days.
Q. How many times a day do users interact with their phone?
A. People tapped, swiped and clicked a whopping 2,617 times each day, on average.
For the heaviest users—the top 10%—average interactions doubled to 5,427 touches a day.
Per year, that’s nearly 1 million touches on average—and 2 million for the less restrained among us.
We’re definitely letting our fingers do the walking, and they’re doing marathons. Each tap and swipe feels small and harmless—just a tiny fraction of our brain power and physical effort. But at these volumes, have the interactions become an onerous load?
Phone screen time was 2.42 hours for the average user, and 3.75 hours for the heavy user. That was time spent on everything from typing texts, swiping on Tinder, turning Kindle pages, and scrolling in Facebook.

Q. How about sessions—how many separate times a day do people actually pick up their mobile phone to use it?
A. The average user engaged in 76 separate phone sessions a day. Heavy users (the top 10%) averaged 132 sessions a day.
We aren’t necessarily glued to our phones for long periods. It’s more like 76 reps a day with a five-ounce dumbbell. Long usage sessions are rare—mostly Netflix and reading. In general, people prefer lots of little sessions with breaks in between.

Q. What time of day do people use their phones most?
A. Activity drops (but far from disappears) in the predawn hours. At 7AM, touches explode, ramping up almost continuously until dinner time.
And what happens after dinner? Are we simply switching to a new screen?
The chart below shows that people tend to put down their phones at bedtime. But we also found that on average, 11% of scouts are getting in a tap or two even at 3AM. In fact, over the course of our five-day study, 87% of participants checked their phones at least once between midnight and 5am.
The fingers never sleep.

Q: I can use my phone without even unlocking it. That doesn’t count, right?
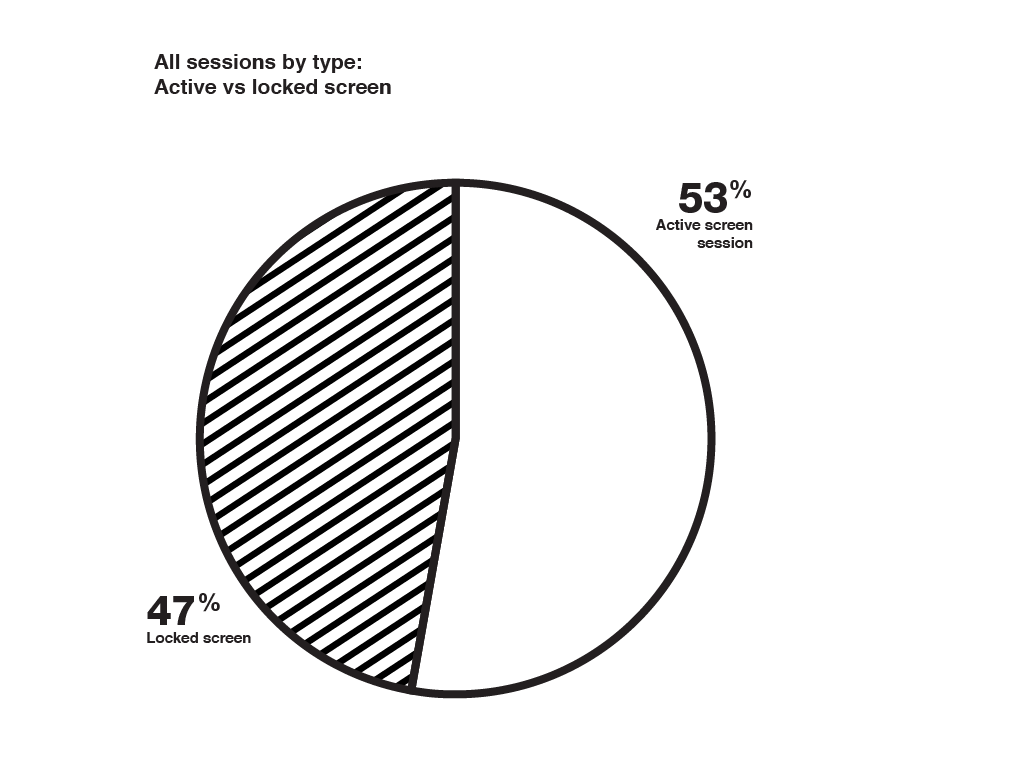
A. Of course not—not any more than the calories we aren’t counting from that last donut. Nearly half (47%) of all user sessions were on locked phones.
We can track when users clicked their phone out of a sleep state, but we can’t capture all the clicks and taps made on locked phones. When a phone is locked—their password hasn’t been entered—a user can still conduct many activities: review notifications, check the time, change the volume, skip a song, etc. So that whopping 2,617 average daily touches is actually a low-ball figure.
But those locked-phone interactions are very shallow—and perhaps very OCD. Maybe just plain Pavlovian: My phone is down. Must check my phone. Whew, that’s better. I see my phone. Must check my phone. Ah, no messages. Good. Where is my phone? Must check my phone.
Is it worth the constant interruption? Few of us notice we’re doing it. It’s too brief. But give humans an opportunity for distraction, and we’ll take it.

Q: I have more apps on my phone than I can count. How many apps are people actually using?
A. So many touches, so few apps receiving them. More than half of active phone sessions were used for no more than one app.
Together, our scouts used 700+ different apps over 5 days. But more than half the times that they picked up their phone, their fingers had just one destination: 52% of their sessions were to use a single app. No app in particular, but no more than one per session.
Another 40% of the time, people used just two or three apps. Engagement is narrow and focused, not that much multitasking. Hop in, pick your obsession, and stick with it.

Q. Just one app per session? Let me guess…
A. Yes, it was Facebook who won in total number of touches. The app racked up more finger time than native messaging or even the home screen.

Overall, nothing gets the fingers moving like communication, which outweighed information gathering. Messaging and social media (unshaded in the graphic below) apps totaled 26% and 22% of interactions respectively, while internet search browsers comprised 10%.
After Facebook (15%), native messaging (11%), and the home screen (9%), Chrome came in a distant fourth (5%—or 8% if you combine the Chrome and Google apps).
Sure, it’s a hard to be one of the chosen few downloaded from the app store. But it’s even harder to design an experience that holds up against Facebook and Chrome—the most popular apps in the world. If you can’t, then your app, be it for banking or a mobile mirror, falls very quickly into that longtail.
Q. Are some apps touchier than others?
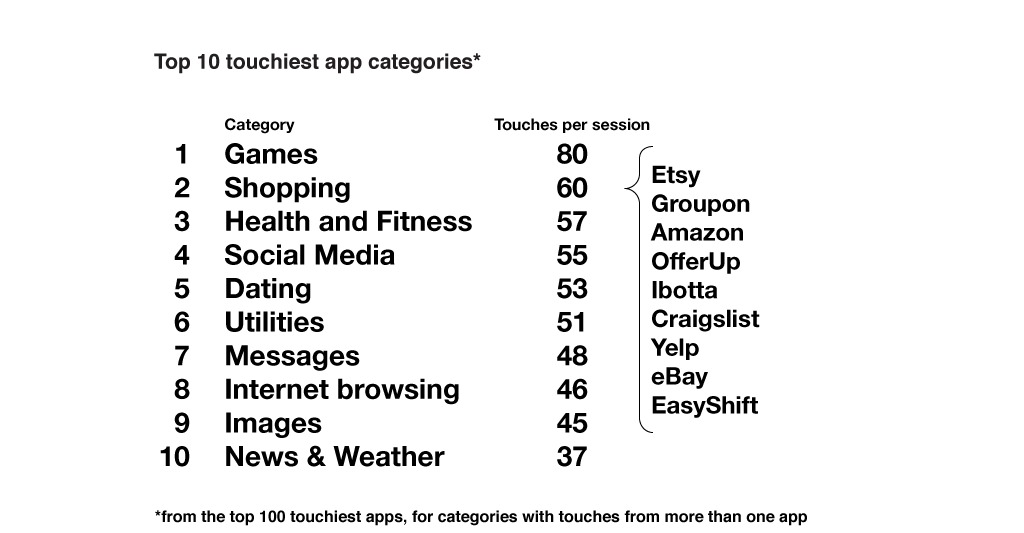
A. Given Facebook’s win for “most touches” and Google’s win for “most sessions,” we expected social media or search to take the “touches per session” prize, but...
Gaming, of course. And after gaming…still not social media or search. Our fingers are like to linger in shopping apps. Even here we were surprised—the touchiest shopping app was Etsy, followed by Groupon.
In general, apps lacking many touches also lacked sessions—with the exception of browsers. Chrome, specifically, has lots of sessions, but not so many touches. You go in, get what you’re looking for, and you get out.

Q. How often do we touch anything that’s *not* made by Google or Facebook?
A. Nearly half of touches were guided by apps made by Alphabet and Zuckerberg. The other half were split among the other 700+ apps.
Facebook, Inc. dominated the top ten with its four big apps: Facebook, Instagram, Messenger, and What’sApp (27%). The Facebook app alone recorded 50% more interactions than any other application or service.
Alphabet’s apps—Google, YouTube, Chrome, Gmail, Hangouts—came in second with 16%. (Note: As this particular study was conducted exclusively on Android phones, Apple was not present.)
The only independent app to crack the top 10 was Textra. (And, of course, dscout. Unicorn alert! Also, our app is where every participant recorded their qualitative research responses.)

Q. Why do I use Tinder and Netflix together?
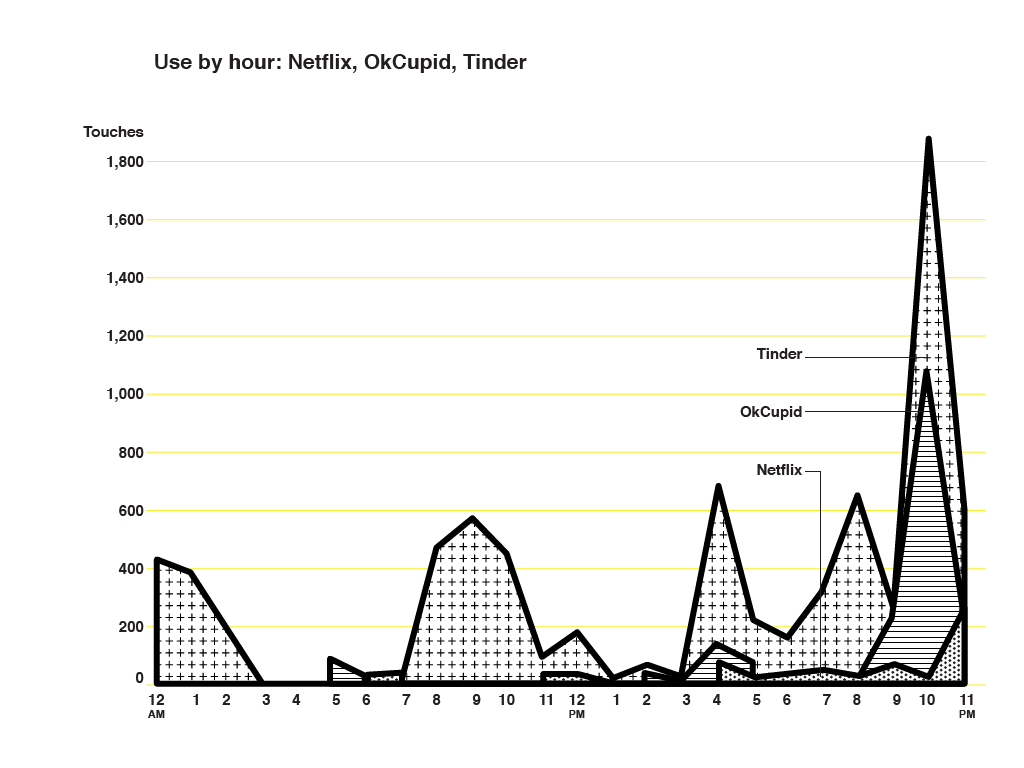
A. We wish we knew! The two apps (plus OkCupid) had their highest use during the same time periods: the few hours after school, after work, and during prime time.
All day, we search, we message, we Facebook. Repeat. When the sun sets, we chill and swipe. Is Netflix complemented by or competing with Tinder and OkCupid? Probably neither, but we wonder which other apps are competing for share based on different times of day.

Q. Do people give a sh!t about tapping one or two million times a year?
A. Not really. According to 68% of scouts, learning about their level of phone use is stunning!
And then it’s not.
Very few had accurately estimated how frequently they would tap, swipe and click. In fact, 66% of scouts underestimated their phone obsession—by a long shot.
Participant reactions to the hard numbers of their actual phone use typically started with five seconds of shock and ended with a wholehearted “meh.” Most admitted to a very shallow desire or intent to change their behavior.
Are these touches well spent?
Was all this highly concentrated, highly tactile interaction good or bad? Is it time well spent? We don’t know. We’re just scratching the surface on touches. We’d love to incorporate your questions into our next round of research on this topic. Some questions we’re thinking about:
How will these physical interaction patterns be supplanted by voice interaction? Is that where new apps can gain their share of thumb miles—by turning them into voice miles?
How will this affect the shift to autonomous automobiles, when people are clearly more interested in their phones than their cars?
Is the phone a replacement for human socialization any more than your computer is a replacement for doing your job?
So that’s our next step—getting to the “why” behind all these touches and taps. What questions do you have? Tell us in the comments below!
Want a shareable version of the report to dig into the data yourself? Download the full report!
Additional research and contributions by Jess Mons
Michael Winnick is the CEO and founder of dscout. Since the platform's founding, research leaders have tapped Michael’s personal passion for harnessing context-rich, human insight to drive innovation.
Michael previously served as gravitytank’s managing partner, steering the innovation consultancy through continuous growth for nearly a decade, prior to its acquisition by Salesforce. He’s led product development at Bay Area start-ups and media companies, including WIRED.

Subscribe To People Nerds
A weekly roundup of interviews, pro tips and original research designed for people who are interested in people


