
STUDY DESIGN: The Magic Button Diaries
How to gain insights with real-time remote research
“On demand” is no longer a consumer convenience, a feature or a luxury—it’s an expectation. This is a significant shift for the design world—one the dscout research team wanted to understand. To begin that exploration, we decided to learn what people would do if they had the ability to fulfill their most immediate needs. What if they had a “magic button” to get what they wanted, when they wanted it?
We tackled with the “The Magic Button” study with an approach that’s somewhat unconventional because we had many questions that could not be posed directly to participants: What does “now” mean in these moments of need? What product categories most need “now” solutions? Which problems can immediate delivery really solve? And, who do consumers think is most likely to deliver the tools to solve them?
We started by discovering what happens during these moments of immediate need. We captured 486 moments for analysis. That framework emerged from analysis of the questions and answers that touched on purchase motivations: How urgent was the need? How fleeting? And how elusive was the solution?
That’s a lot of questions. You can get many of the answers—what people “bought” and why, along with a framework of five need-based modes that we identified: Seek, Save, Stock, Serve and Spoil—in this article, in this web clinic and in this detailed deck.
But a much bigger question we’d like to answer for you here is: How did we design this study? And why did we structure it that way? We’ll share this with you in 3 sections:
- How we designed the study
- How we recruited people
- How we made sense of it all

1. How we designed the study
Get them “In the Moment”
We wanted to catch people reflecting on these moments of need in real-time, wherever they may be, whenever they may happen. This type of research just can’t be tackled with a focus group or a standard survey.
We designed the study so people could capture moments in real time using the dscout mobile app, choosing fifty participants to capture ten “right now” moments over the course of eight days. It turns out that when you don’t confine your participants to a lab, with only their memory to work with, they’ll show you some fascinating parts of their day to day life.
We found that fifty participants is a good middle ground for remote, qualitative research. We have the scale to validate patterns, but the data is manageable. We decided that the project would last 8 days, to ensure that we included a full week and weekend. We asked for 10 "right now" moments. This is a lot when you consider how often the typical person shops online or in stores, but we wanted to push people to think outside the obvious and use the button in ways we wouldn't anticipate.
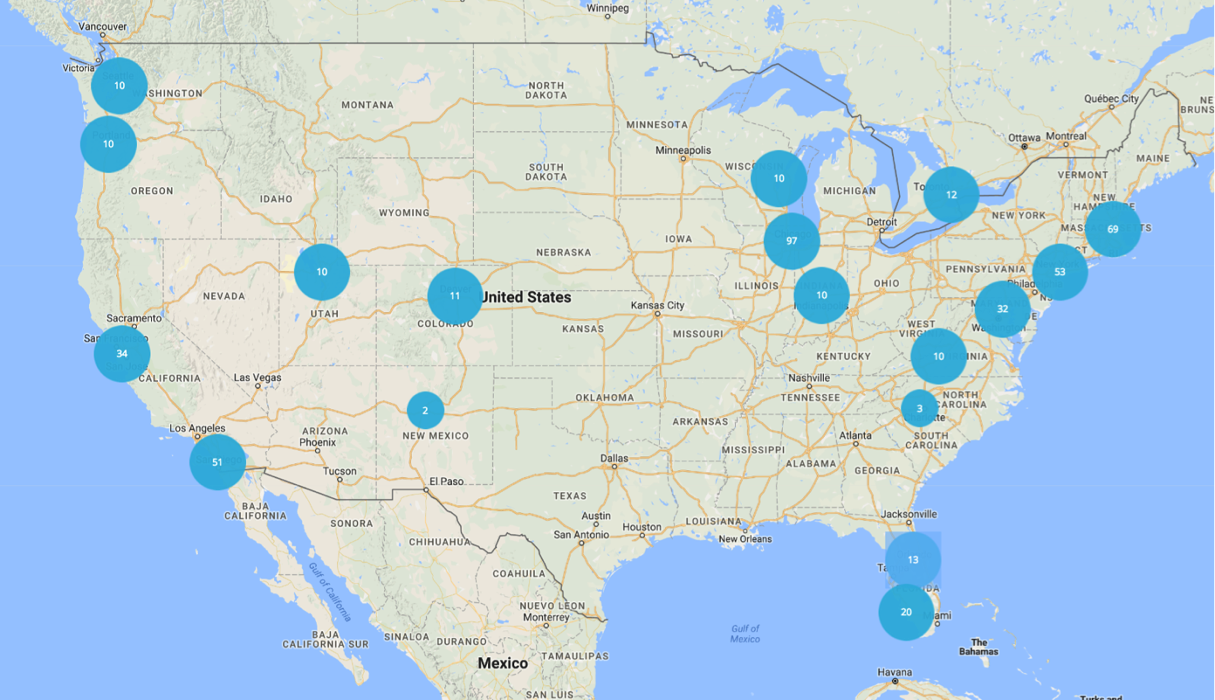
We were able to capture 486 moments from 50 people across the country, without ever having to leave Chicago.
Introduce mental props to make the task clear and engaging
The Magic Button is a mental prop, a mental stimuli that helped participants recognize their “right now” needs. When we began the study, we told people they were in possession of a “magic button.” When pressed, the button would instantly purchase and deliver any item of their choosing. They would carry this “magic button” around with them for a week. This crystallized the concept and made it tangible, so participants could build on it and add their own interpretation.

“In your application, we told you about a magic button that, when pressed, purchases the exact product you want or need and delivers it to you instantly! Congrats, you know have your very own!"
Write with constraints to keep participants focused
Remote research is strongest when it frames a task with constraints that promote relevance and depth, yet provide space for discovery. In this case, we said the needed item had to be available in real life, and that the respondent had to imagine its purchase was linked to their bank account. For example, you can’t use the button to invite Steve Jobs to dinner, and you (probably) can’t use the button to buy a Bugatti. But you can buy dinner or an Uber ride.
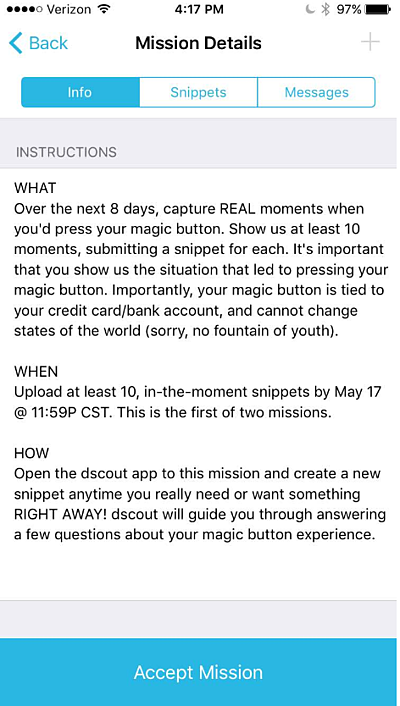
Importantly, your magic button is tied to your credit card/bank account, and cannot change states of the world (sorry, no fountain of youth).
Plan for Your Endgame
We structured the research with the output in mind. Anytime someone wanted to show a “right now” moment, they opened the dscout app to create an entry. Each entry consisted of 10 questions, including open-ended, closed-ended, and scale questions, plus a video prompt. Each set of responses comprised a “moment” and each moment was structured the same way.
Open-ended questions are key for discovery and understanding, but structured questions ease your analysis. Think of ways your participants might answer some of their open-ended questions, and provide a closed ended question that frames some of those answers and perhaps provides an “other.
Think questions like “Do you want this or need this?” or “without the button, would you still buy this?” You can even run a small pilot mission to gather ideas for closed-ended responses.

Allow for reflection
After focusing on the details of their daily needs, we wanted to broaden the aperture and give participants a chance to share their thoughts on the experience. So after a week of showing really focused moments, we asked people to answer a set of reflective questions: What did they think of the button? What would stop you from using a magic button? What company would make this product? The answers to these questions give our insights more depth and context.

2. How we recruited participants
Screen for behaviors and demographics
We needed scouts who would show us 10 “right now” moments within 8 days. In order to terminate applicants who do not shop frequently, we included “knockout” questions. We also asked “who's primarily responsible for the shopping in your household?”
Applicants answered questions about the product categories they typically shop, the devices they use and their favorite stores. Our goal was to gain some diversity of preferences and behaviors. We also asked about tech savviness and urban/rural/suburban locations, thinking these factors impact the perception and demand for immediacy.
Screen for eloquence, thoughtfulness and imagination
Next, applicants were asked to explain a recent time they got something quickly. Our goal was to gauge how resourceful and thoughtful they are with this concept of immediate need.
We then introduced the magic button concept and asked scouts to share their initial impression of this button in a 30 second video. We were able to weed out people who were totally disinterested in the concept, but more importantly we got a sense for the personality of each applicant. Videos allowed us to see how applicants carry themselves present their thoughts. The video is like an audition and we were auditioning for eloquence, thoughtfulness and imagination.
Here’s what it looks like in the platform to the researcher:

3. How we made sense of it all
We saw patterns emerge across the 486 moments: Was the need urgent? Was it fleeting? Ultimately, we identified five types of magic button moments: Stock, Seek, Save, Spoil, and Serve. Here’s how we got there.
Marinate
When the missions were complete, we immersed ourselves in the data. We started by reviewing entries individually, then absorbing some of the data in aggregate to begin identifying interesting nuance and patterns, surfacing initial findings, and then informing a more strategic approach.
At this early stage it’s important to share your initial impressions with colleagues to help you identify and craft the story your data is telling. We printed out snippets from our favorite scouts and sorted them into categories. Our goal was to gain a robust understanding of the data.
Develop a tag list
Within our immersion, we discovered that there were huge differences in WHY people were using the button. By asking, “what problem is the button solving in this moment?” we were able to delineate the 486 moments according a qualitative framework of Stock, Seek, Save, Spoil, and Serve.
We begin by adding these tags to 20% of the entries, and then paused to evaluate how the tag list was working to capture all of the data. The goal is to revisit the themes, condense in some places, expand in other places, and rename as needed to perfect your tag list before you've invested time tagging your entire data set.
Tell a story
Once our data was tagged and our framework was testing, we set out to quantify patterns and examine relationships between them.
We segmented the data by our thematic tags (the 5 modes), descriptive tags (product category) and responses to questions. We did this using a cross tabulation (crosstab), a table that displays frequency counts for your data set. Our crosstabs allowed us to evaluate the intersections of certain attributes, by displaying the frequency with which combinations occur. For example, a crosstab helped us discover that 62% of “spoil” moments would not happen without the immediacy the magic button delivers and that in 69% of “spoil” moments people were using the button to buy food or groceries.
Once we understood the relationships between the different types of magic button moments, we organized all of our insights into a story.
If you’re interested in reading this story: you can find a full deck here!
Jaymie Wahlen is the VP of Customer Success at dscout, where she works to make dscout the most customer-centric company on the block. When she’s not leading dscout’s team of Research Advisors, you can find Jaymie spinning a pottery wheel, or seeking out the world’s best street food.


