
Three Approaches to Tagging that Bring Clarity to Qual Data
Explore what tagging is, where to use it, and how to ensure it works towards your synthesis goals.
Qual data: it’s rich, it’s impactful, and it’s messy.
As researchers, rendering order from chaos is one of our chief responsibilities.
There are countless approaches and strategies for unearthing insights (and stories) from qual data. But one of the most versatile tools in our toolkit is tagging—grouping like responses so they can be categorized into impactful themes.
If you’re new to tagging, it can be difficult to know where to begin. Here are three approaches to tagging your data, based on the synthesis goal you’re looking to accomplish. We’ll break down the steps you can take to meet those goals, and give an example of how applying these tag-types might work in practice.
Quick note: Tagging is an extremely versatile tool with a lot of different potential processes and applications. The approaches laid out here have worked for me as a dscout researcher and are best suited to tagging survey data or longitudinal study data.
In-depth interviews, focus groups, and other types of qual research lend themselves to different tagging approaches. Use these tips as a jumping-off point and figure out what works for you.
Jump to:
I want to bookmark moments to revisit
If you’re new to tagging your data, this is the easiest way to start. Tags can be a great way to chase down a particular subset of data that you don’t want to lose track of.
Here, they function like sophisticated note-taking—giving you reference points that should make for easier recall and analysis.
Use this technique if you want to…
- Find your place in a long string of data
- Keep track of open-ends with particular emerging themes
- Sort responses into broad, loose categories
- Note keywords that you want to keep track of as they come up
- Flag responses for a specific type of follow-up analysis
- Document your thoughts as you go
How to use organizational tags
1. Think ahead about what you might want to keep track of
These could be mentions of a particular word or theme, something of particularly high or low quality, or just an anomaly that you encounter and want to return to.
2. Tag as you go
Don’t be afraid to get messy with this kind of tag. Think of it as keeping a sticky note in a book you’re studying. When something comes up you want to remember, leave a tag. You can always adjust the names of your tags if you start to see more consistent patterns emerge.
3. Revisit your tags for further analysis
Come back to tags and see if any new ideas stick out to you, or just use them to organize data for future deliverables.
Example: Cross-generational conversations
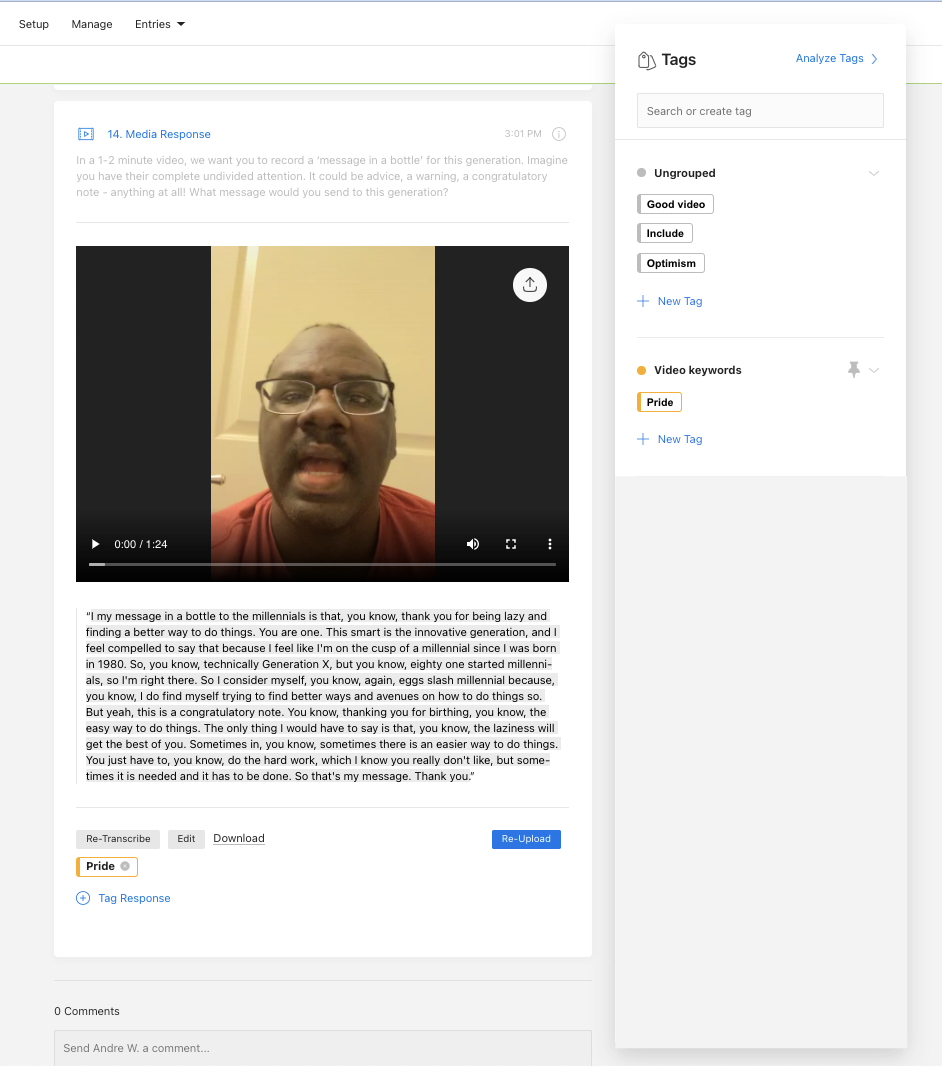
I’m running a study where participants have an opportunity to share messages with other generations.
As I immerse myself in videos, I know I’m interested in messages where scouts tell younger generations they’re proud of them. So I make a keyword tag to keep track of those moments. I also like this video because the scout is articulate, so I bookmark it as a “good video” as well.
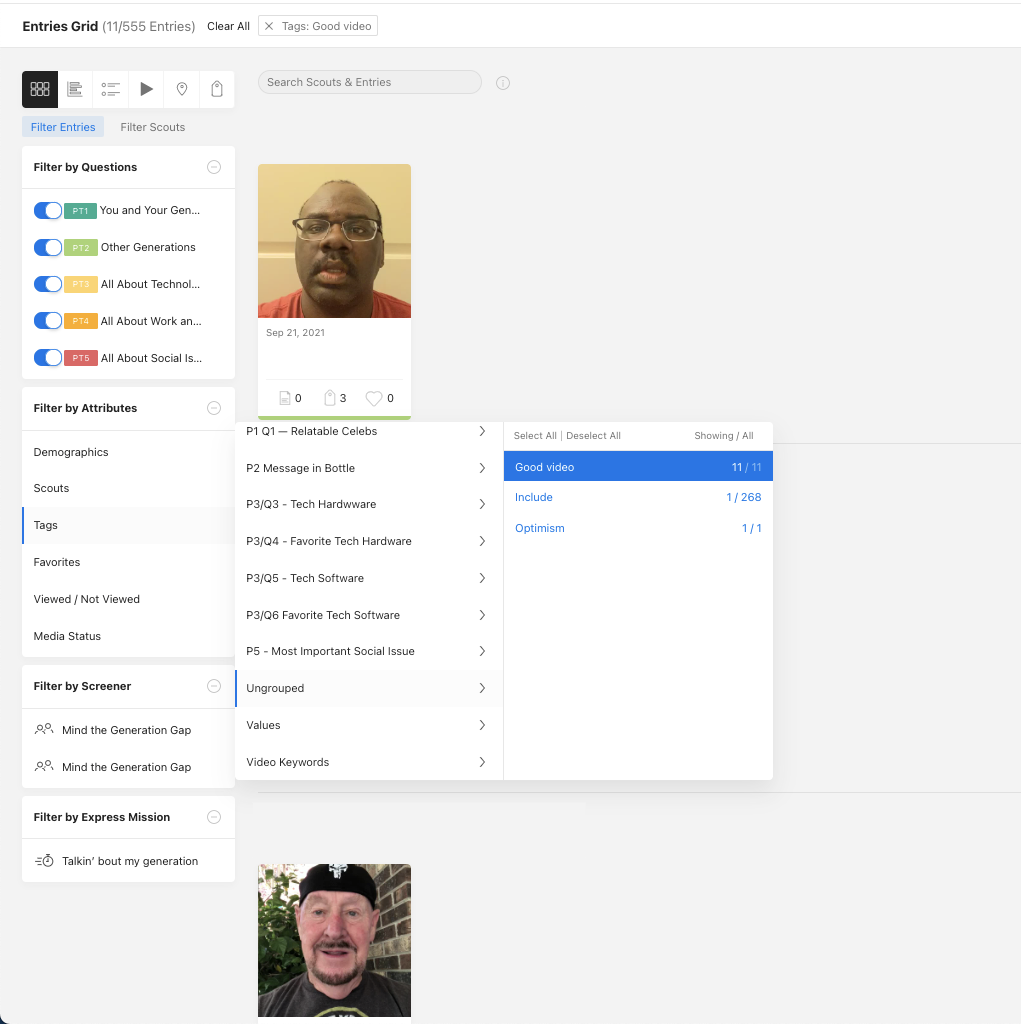
Later, I can use the tag view to revisit videos with highlighted keywords to look for patterns and themes.

I can also filter to these tags when I’m looking for quotes or videos to build deliverables.
These tags are usually purely for organizational purposes. They’re not good for formally counting things or presenting data—just for finding things that might be relevant later. If you want to quantify and present your data, then you’ll want a slightly more formal approach.
I want to quantify qualitative data
Tags used to quantify data are often called descriptive tags. It’s a bread-and-butter technique where we translate open-ended data into counts that we can compare and organize. It’s more formal than the last technique but still doesn’t require too much thought work.
Quantifying with tags is great for transforming qualitative data into something a little more digestible. Findings like “54 out of 60 respondents mentioned this idea” are splashy and stick with stakeholders—that’s what these tags are for!
Use this technique if you want to...
- Filter or slice data by information that only exists in an open-end
- Cross-reference open-ended data with close-ended data
- Count mentions of things, places, or ideas in open-ends
- Show numbers or charts based on qualitative responses
How to use descriptive tags
1. If you can, avoid it
This kind of tagging can often simply be avoided by changing an open-end into a multiple-choice question instead. You’ll save your scouts writing time and you’ll save yourself a lot of tagging effort down the road.
Instead of: “Where are you right now?”
Try: “Where are you right now?
- Commuting
- At work
- At school
- At home
- Other (tap to type)
If you truly have no ideas about your customers’ thoughts or habits or don’t feel comfortable making assumptions, then that’s a good indicator to leave it as an open-end and plan to tag instead.
2. Identify the questions you need to tag
Descriptive tagging will almost always be done on a single response. The goal is simply to turn qualitative data 1-to-1 into quantitative data. Identify the questions you want to apply tags to by determining whether it’s crucial to a) count the answers or b) sort by those answers. If neither of those is necessary, skip it!
3. Determine whether your tags should be exhaustive or not
Tags can either be exhaustive, (meaning that every answer is tagged with something), or they can be non-exhaustive, meaning that some answers will have no tags.
Non-exhaustive tags might work well if you are looking to count occurrences of a specific event or mentions of a theme—for instance, if you ask people to set up an account for your digital process, you may tag specific errors or issues that arise, and leave the error-free moments untagged.
Often though, I prefer exhaustive to non-exhaustive tags because they account for the entire dataset instead of just your topic of interest. Exhaustive tags also allow you to compare your point of interest to other answers and not just the size of the total dataset.
For example, imagine you want to count how many people are home when using your product by tagging 50 answers to the question, “Where are you right now?” You could non-exhaustively count how many people said “home” and find that 20/50 answered that way.
But if you tag all the answers, you might find that “home” was the most common answer, and all other answers only occurred a maximum of 10 times. That’s a more rigorous and more interesting observation.
4. Tag your data
These tags can usually be applied without much thought or previous viewing of the data. If you make a plan ahead of time, you can even tag the data right as it comes in.
For example, if you have hypotheses or research questions that center on where people use your product (e.g. “we think people use our product to pass time on a commute”), then you know that location will be a key organizational tool and therefore should be tagged.
If you know that ahead of time, you can start applying these tags right as you receive and immerse yourself in data, and save yourself a separate tagging session.
5. Use the results in deliverables, or for better organization
Changing open-ended responses into numbers can make insights easier to understand and faster to communicate. You might present any quantified data in the form of bar charts (below), pie charts, or other kinds of comparative read-outs.
Descriptive tags also function organizationally (just like bookmarks do). Use filters to your advantage to drill down into the tagged responses you’re most interested in, or to compare and contrast different groups of tagged entries.
Example: Quantifying shopping sites
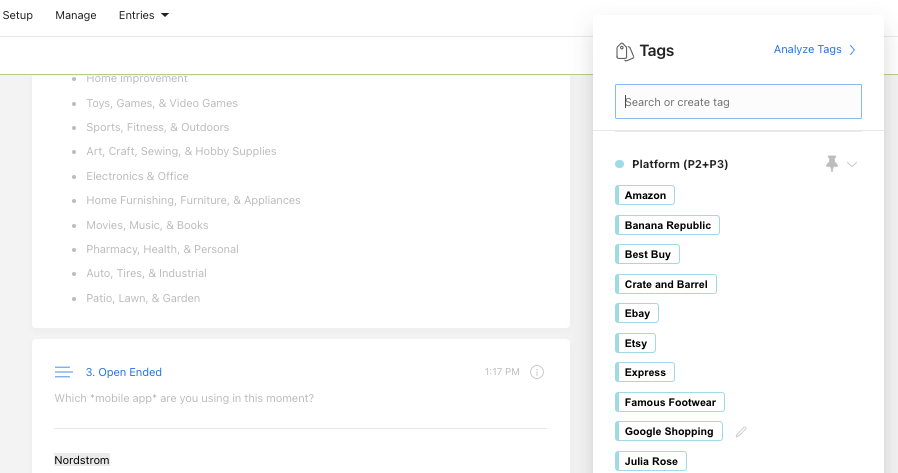
In another recent study, we were learning about shopping habits online. I asked people to tell me what website they visited in an open-ended question. I quickly created a tag list based on the answers people gave and tagged the results.
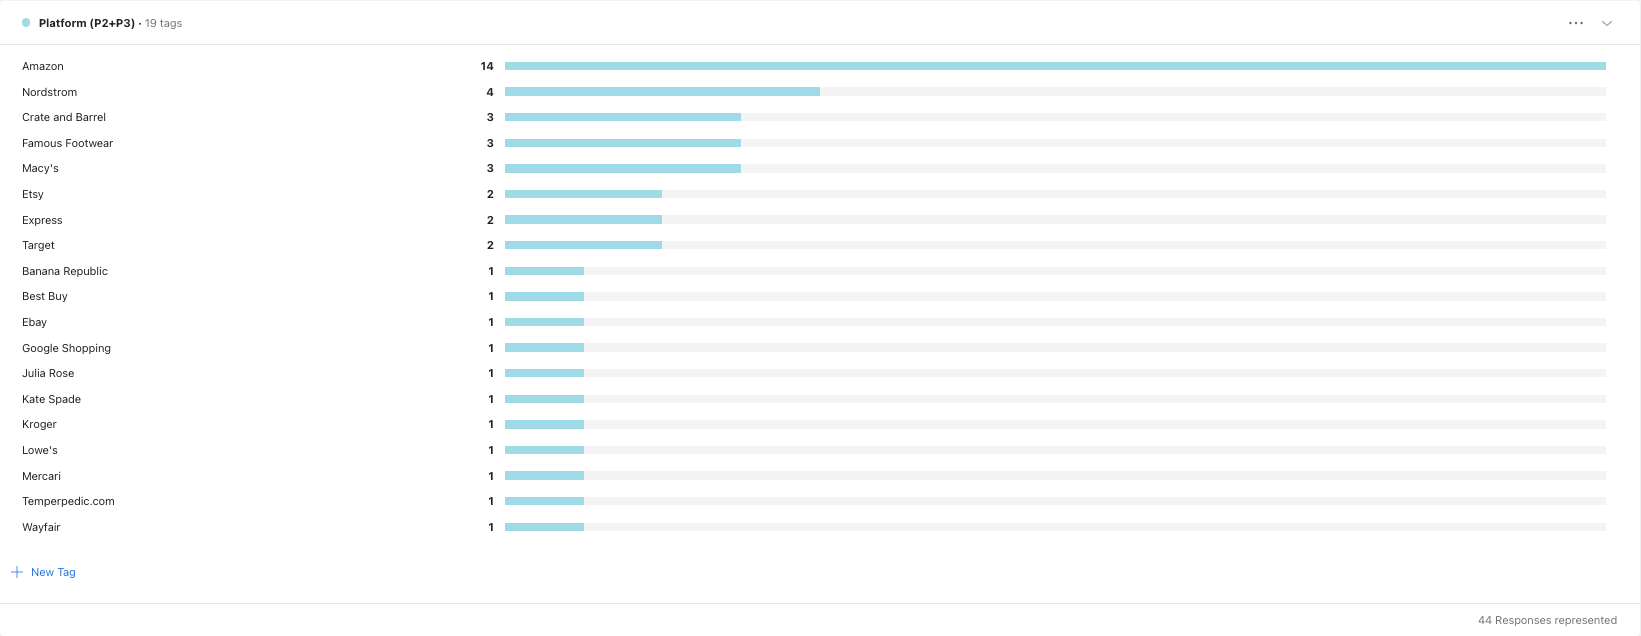
Tagging allowed me to quantitatively examine this originally qualitative data. I discovered that Amazon is by far the most-visited site in my study! If my stakeholders are interested in this, I could show this chart directly in a deliverable.
This tagged data also benefited me organizationally. I can also now filter by tag to moments that specifically happened on any one of those websites, to see if there are site-specific patterns in the rest of my data.
I want to synthesize my data
We’ve written about inductive tagging in the past. It involves looking at your data as a whole, uncovering themes, and then returning to organize and quantify those data by those themes.
Use this technique if you want to...
- Highlight or count themes emerging in your data
- Pull together themes that exist across multiple responses
- Quantify a framework that’s emerging in analysis
- Check the validity of a theory you have
- Reduce your bias in thematic analysis
How to synthesize your data
1. Look through your data
Most of the time, the first step to developing higher-level thematic tags is to familiarize yourself with the data first. This may also include adding bookmarking or descriptive tags.
Occasionally, your themes will be predetermined, coming from a hypothesis or the findings of a previous study (this style is called top-down, or deductive tagging). In that case, you can skip this step.
2. Devise a tagging list
These tags aren’t usually a direct translation of open-ends, so you’ll need to do some thinking on what your categories are going to be and what they’ll include. Document your plan somewhere so you can keep track of your plan and share it with others.
3. Consider what the tagging method should be
Will your tagging be exhaustive, or not? Will you apply only one tag per response, or is more than one ok? Make sure you’re clear on your intent and your strategy is communicated across your team.
Pro tip: In my experience, tags of this nature are at their best when they’re exhaustive. New frameworks for your data should explain or account for the entire dataset.
4. Pressure test, if you have time
If you have a big dataset, you may want to take a trial run at a smaller subset of that data and see if your tags are working as you thought they would. If not, go back to the drawing board.
5. Tag your data
If you notice one of your planned tags isn’t working well, try not to stop—complete your tagging as-is and make note of your mistake. The last thing you want is to introduce inconsistencies in your tagging strategies. Consistent and imperfect is better than an inconsistent mess!
6. Iterate
If you found parts of tagging that need refining, now is the time to go back, break out new themes, sort things into and out of the ‘other’ category, etc.
7. Use your new tags to dig deeper
Now that you have thematic tags, you can filter by those new categories and find more information that holds them in common. You can also repeat this process with a whole new set of tags if your tagging revealed a new idea or insight that you want to pursue.
8. Show your insights off, qualitatively or quantitatively
It’s up to you whether you want to display the counts of these tags directly as part of your deliverable, or just use them as a guiding framework to talk your stakeholders through your findings.
Example: Music moments
Our team ran a study about streaming music where we asked scouts to share the music they were listening to at the moment as they began listening to it. Each time they turned on their streaming apps, they booted up dscout and recorded a video telling us why they chose that music.
In this study, we used some descriptive tags—for example, we asked, “What app are you using to stream right now?” and tagged that data as it came in.
After looking through the data, we also noticed patterns in the types of activities that people were doing as they turned on their playlists. We never asked this outright, but instead pieced it together from immersing ourselves in the context scouts provided in their videos.
From this, we developed a tag list of activities:
- Background Music
- Cleaning
- Commuting
- Exercise (class)
- Exercise (running)
- Exercise (walking)
- Going to Sleep
- Housework
- Improving mood
- Increasing energy
- Playing video games
- Relaxing
- Self-care routine
- Working
As a team, we talked through this tag list and made sure our framework of activities accounted for all the data that we gathered. Once we were relatively certain of our categories, we got started tagging.
It was valuable in and of itself to parse out the various reasons why people would turn on music and understand which instances were most common.
Having done the up-front work of tagging, we were also able to filter to each individual activity use case and thoroughly describe the desires and frustrations of users in those moments. The needs of someone putting on tunes to relax and take a bath are very different from someone who is commuting or powering through a tough workout.
With the framework we developed, we were able to bring those differences front and center, instead of having them lost in the noise of qualitative data.
To learn more about research with dscout or how tagging works on our platform, get in touch with a member of our team.
Karen is a researcher at dscout. She has a master’s degree in linguistics and loves learning about how people communicate with each other. Her specialty is in gender representation in children’s media, and she’ll talk your ear off about Disney Princesses if given half the chance.


Subscribe To People Nerds
A weekly roundup of interviews, pro tips and original research designed for people who are interested in people


